3.1. Building a Database Query Application#
Throughout this section, we will be developing an application in Streamlit that looks like this:
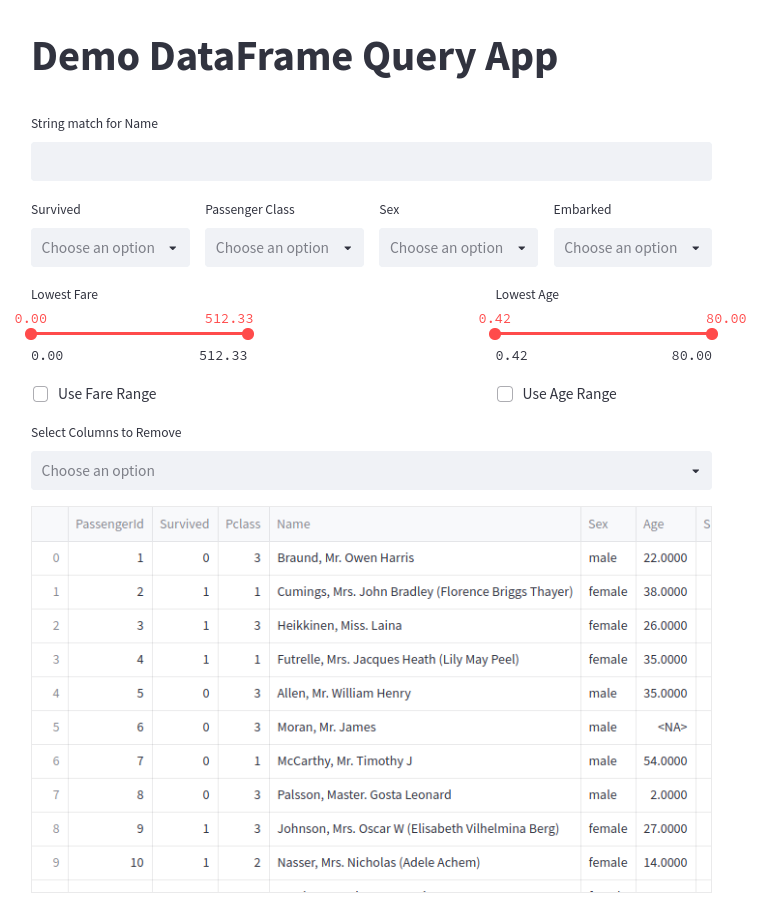
Fig. 3.5 Example of the Demo Application#
We will be working with the following code:
import streamlit as st
import pandas as pd

# Cache our data
@st.cache()
def load_df():
    df = pd.read_csv("./data/titanic.csv")
    survival_options = df.Survived.unique()
    p_class_options = df.Pclass.unique()
    sex_options = df.Sex.unique()
    embark_options = df.Embarked.unique()


    min_fare = df.Fare.min()
    max_fare = df.Fare.max()

    min_age = df.Age.min()
    max_age = df.Age.max()

    return df, survival_options, p_class_options, sex_options, embark_options, min_fare, max_fare, min_age, max_age

def check_rows(column, options):
    return res.loc[res[column].isin(options)]

st.title("Demo DataFrame Query App")

df, survival_options, p_class_options, sex_options, embark_options, min_fare, max_fare, min_age, max_age = load_df()
res = df

name_query = st.text_input("String match for Name")

cols = st.columns(4)
survival = cols[0].multiselect("Survived", survival_options)
p_class = cols[1].multiselect("Passenger Class", p_class_options)
sex = cols[2].multiselect("Sex", sex_options)
embark = cols[3].multiselect("Embarked", embark_options)

range_cols = st.columns(3)
min_fare_range, max_fare_range = range_cols[0].slider("Lowest Fare", float(min_fare), float(max_fare),
                                        [float(min_fare), float(max_fare)])
min_age_range, max_age_range = range_cols[2].slider("Lowest Age", float(min_age), float(max_age),
                                        [float(min_age), float(max_age)])


if name_query != "":
    res = res.loc[res.Name.str.contains(name_query)]

if survival:
    res = check_rows("Survived", survival)
if p_class:
    res = check_rows("Pclass", p_class)
if sex:
    res = check_rows("Sex", sex)
if embark:
    res = check_rows("Embarked", embark)
if range_cols[0].checkbox("Use Fare Range"):
    res = res.loc[(res.Fare > min_fare_range) & (res.Age < max_fare_range)]
if range_cols[2].checkbox("Use Age Range"):
    res = res.loc[(res.Age > min_age_range) & (res.Age < max_age_range)]
removal_columns = st.multiselect("Select Columns to Remove", df.columns.tolist())
for column in removal_columns:
    res = res.drop(column, axis=1)
st.write(res)
By the end of this chapter, you will be able to understand and parse each line of this code.
3.1.1. Importing the Libraries#
At the start of our Python file, we first import the required libraries. We are using Streamlit for the app development and Pandas for working with our data.
import streamlit as st
import pandas as pd
3.1.2. Caching Data#
Let’s examine the next section of code.
@st.cache()
def load_df():
    df = pd.read_csv("./data/titanic.csv")
    survival_options = df.Survived.unique()
    p_class_options = df.Pclass.unique()
    sex_options = df.Sex.unique()
    embark_options = df.Embarked.unique()


    min_fare = df.Fare.min()
    max_fare = df.Fare.max()

    min_age = df.Age.min()
    max_age = df.Age.max()

    return df, survival_options, p_class_options, sex_options, embark_options, min_fare, max_fare, min_age, max_age
The first line is:
@st.cache()
This decorator followed by st.cache() establishes that resulting objects from the function that proceeds it should be cached into memory.
The next line begins the creation of our function.
def load_df():
Once we have defined our function we begin working with our data. First, we load the data:
df = pd.read_csv("./data/titanic.csv")
Next, our application will leverage four st.multiselect() widgets for four different columns in our dataframe. In order to populate a list of options for users to select, we need to know the unique values of each column. We can grab each unique value with .unique() on each column.
    survival_options = df.Survived.unique()
    p_class_options = df.Pclass.unique()
    sex_options = df.Sex.unique()
    embark_options = df.Embarked.unique()
Next, our application will also leverage two sliders: one for Age and one for Fare. These will allow a user to find results based on a person’s age or the fare of their ticket. We need to know the max value and the minimum value for each of these so that we can automatically set the slider minimum and maximum values.
    min_fare = df.Fare.min()
    max_fare = df.Fare.max()

    min_age = df.Age.min()
    max_age = df.Age.max()
Finally, we return all of these values so that when the function is called each of these will be returned.
return df, survival_options, p_class_options, sex_options, embark_options, min_fare, max_fare, min_age, max_age
Once we have created this function, we can call it and create all the objects that we need with the following code:
df, survival_options, p_class_options, sex_options, embark_options, min_fare, max_fare, min_age, max_age = load_df()
We will also create another object whose variable name will be res. This will be the dataframe that gets manipulated by the user and populates the results in the app.
res = df
3.1.3. Creating our App Layout#
After preparing all the data, now comes the time to design the general layout of our application. We use the following code to that:
name_query = st.text_input("String match for Name")

cols = st.columns(4)
survival = cols[0].multiselect("Survived", survival_options)
p_class = cols[1].multiselect("Passenger Class", p_class_options)
sex = cols[2].multiselect("Sex", sex_options)
embark = cols[3].multiselect("Embarked", embark_options)

range_cols = st.columns(3)
min_fare_range, max_fare_range = range_cols[0].slider("Lowest Fare", float(min_fare), float(max_fare),
                                        [float(min_fare), float(max_fare)])
min_age_range, max_age_range = range_cols[2].slider("Lowest Age", float(min_age), float(max_age),
                                        [float(min_age), float(max_age)])
Let’s break down this section of the code. In the first line, we create an object name_query. This will be a string that is returned from a st.text_input() widget. We will use this input to query the Name field in the dataframe.
name_query = st.text_input("String match for Name")
Next, we will create four columns that we can populate with our st.multiselect() widgets.
cols = st.columns(4)
Now that we have our columns, we can create our four st.multiselect() widgets. The user will be able to select which items that want to see returned for each field in the dataframe. Each of these will return a list of options. We will gather data for four fields: Survived, Pclass, Sex, and Embarked.
survival = cols[0].multiselect("Survived", survival_options)
p_class = cols[1].multiselect("Passenger Class", p_class_options)
sex = cols[2].multiselect("Sex", sex_options)
embark = cols[3].multiselect("Embarked", embark_options)
Next, we need three new columns so that we can populate our two range sliders. We are using three columns here so that there is a large gap between the two sliders.
range_cols = st.columns(3)
We will populate the first and last slider, we will place two st.slider() widgets. We will use the minimum and maximum values for the Age and Fare fields in the dataframe.
min_fare_range, max_fare_range = range_cols[0].slider("Lowest Fare", float(min_fare), float(max_fare),
                                        [float(min_fare), float(max_fare)])
min_age_range, max_age_range = range_cols[2].slider("Lowest Age", float(min_age), float(max_age),
                                        [float(min_age), float(max_age)])
3.1.4. Using User Inputs to Produce a New DataFrame#
With the general layout designed, we can then work with the input from the user to modify our res dataframe. The following code manipulates the dataframe through a set of conditions we generate from the user input.
if name_query != "":
    res = res.loc[res.Name.str.contains(name_query)]
if survival:
    res = check_rows("Survived", survival)
if p_class:
    res = check_rows("Pclass", p_class)
if sex:
    res = check_rows("Sex", sex)
if embark:
    res = check_rows("Embarked", embark)
if range_cols[0].checkbox("Use Fare Range"):
    res = res.loc[(res.Fare > min_fare_range) & (res.Age < max_fare_range)]
if range_cols[2].checkbox("Use Age Range"):
    res = res.loc[(res.Age > min_age_range) & (res.Age < max_age_range)]
removal_columns = st.multiselect("Select Columns to Remove", df.columns.tolist())
for column in removal_columns:
    res = res.drop(column, axis=1)
st.write(res)
First, we check to see if the user has written anything in the st.text_input() widget. If it is, then we will narrow the dataframe down to anything that matches the user’s string.
if name_query != "":
    res = res.loc[res.Name.str.contains(name_query)]
For each of the st.multiselect() widget inputs, we check to see if the user has selected how to narrow the dataframe:
if survival:
    res = check_rows("Survived", survival)
if p_class:
    res = check_rows("Pclass", p_class)
if sex:
    res = check_rows("Sex", sex)
if embark:
    res = check_rows("Embarked", embark)
Next, we will use the input from the minimum and maximum values of the sliders for Age and Fare. So that we do not ignore results where Age or Fare are NaN in the dataset, we want to give the user the ability to check an st.checkbox() widget. This will allow the user to activate or deactivate the sliders.
if range_cols[0].checkbox("Use Fare Range"):
    res = res.loc[(res.Fare > min_fare_range) & (res.Age < max_fare_range)]
if range_cols[2].checkbox("Use Age Range"):
    res = res.loc[(res.Age > min_age_range) & (res.Age < max_age_range)]
We also want to give the user one final input, the ability to narrow down and delete columns from the dataset. The reason for this is because not all fields will be relevant to every user and since this is a large dataset, it makes sense to give them the ability to limit which fields they are seeing to the ones they want.
removal_columns = st.multiselect("Select Columns to Remove", df.columns.tolist())
for column in removal_columns:
    res = res.drop(column, axis=1)
As we have manipulated the res dataframe throughout each of these lines, we are finally ready to display the data:
st.write(res)